
-
Current Real-Time
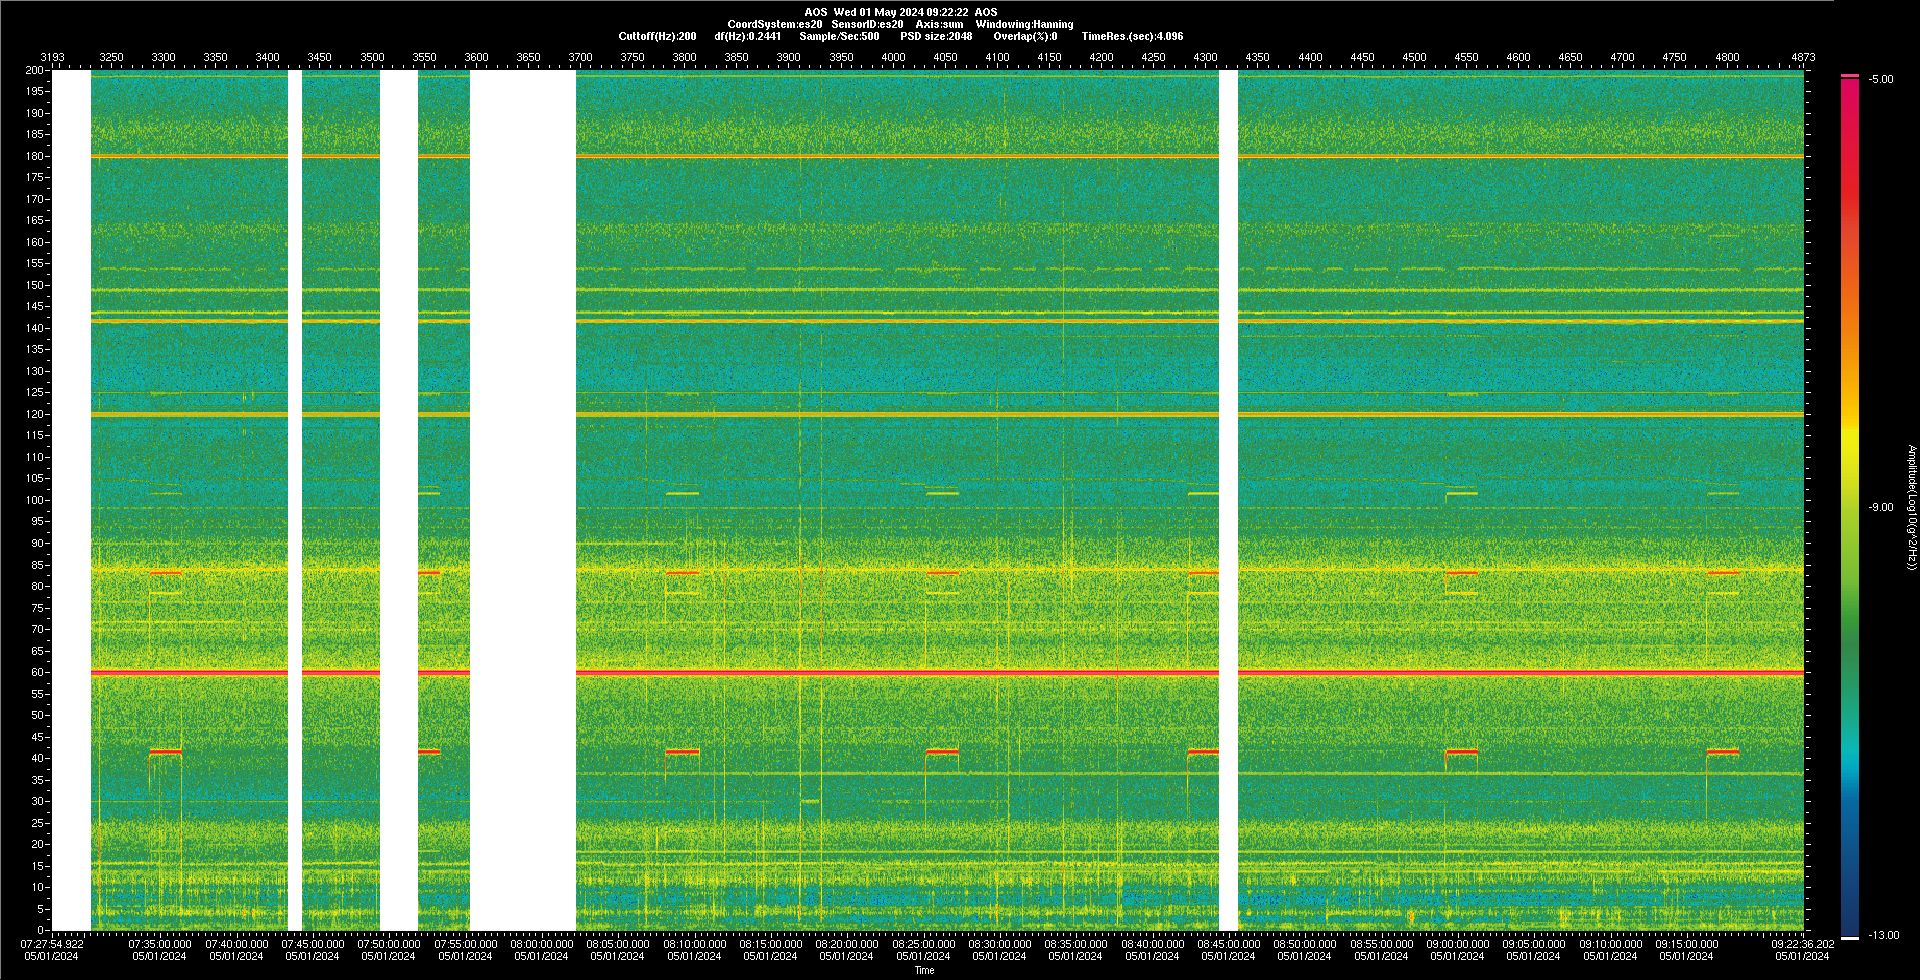
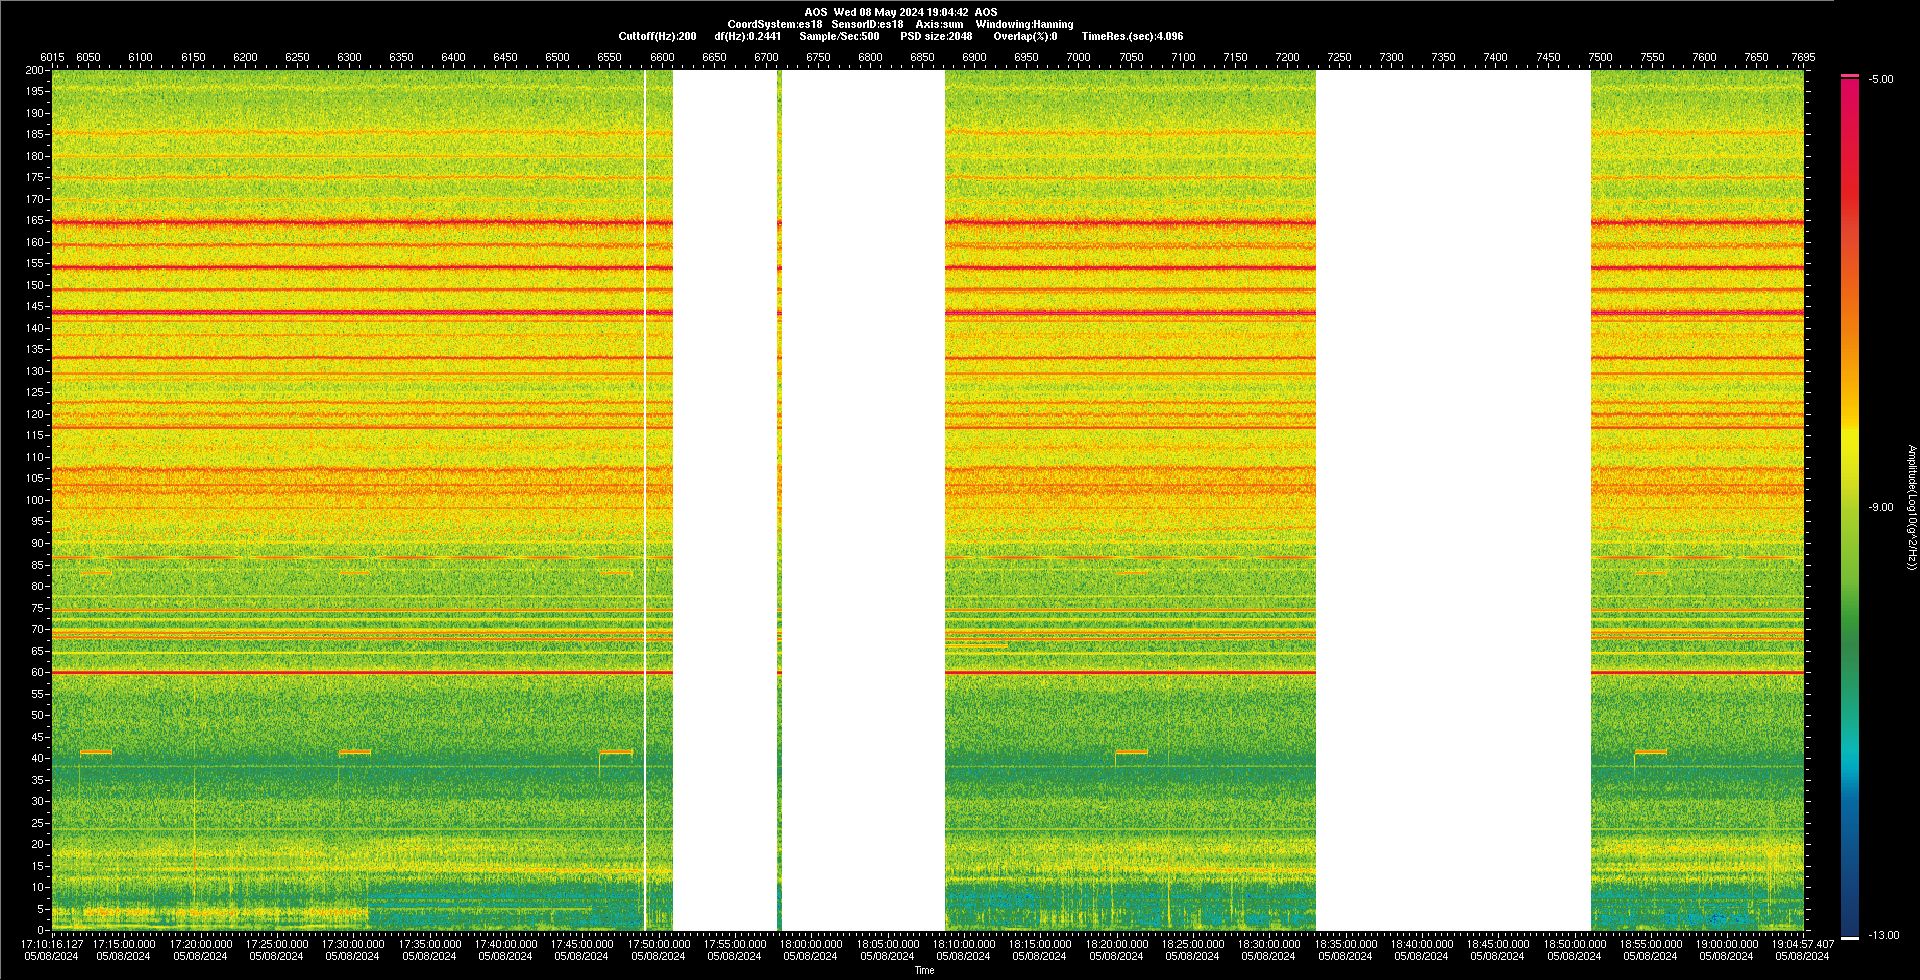
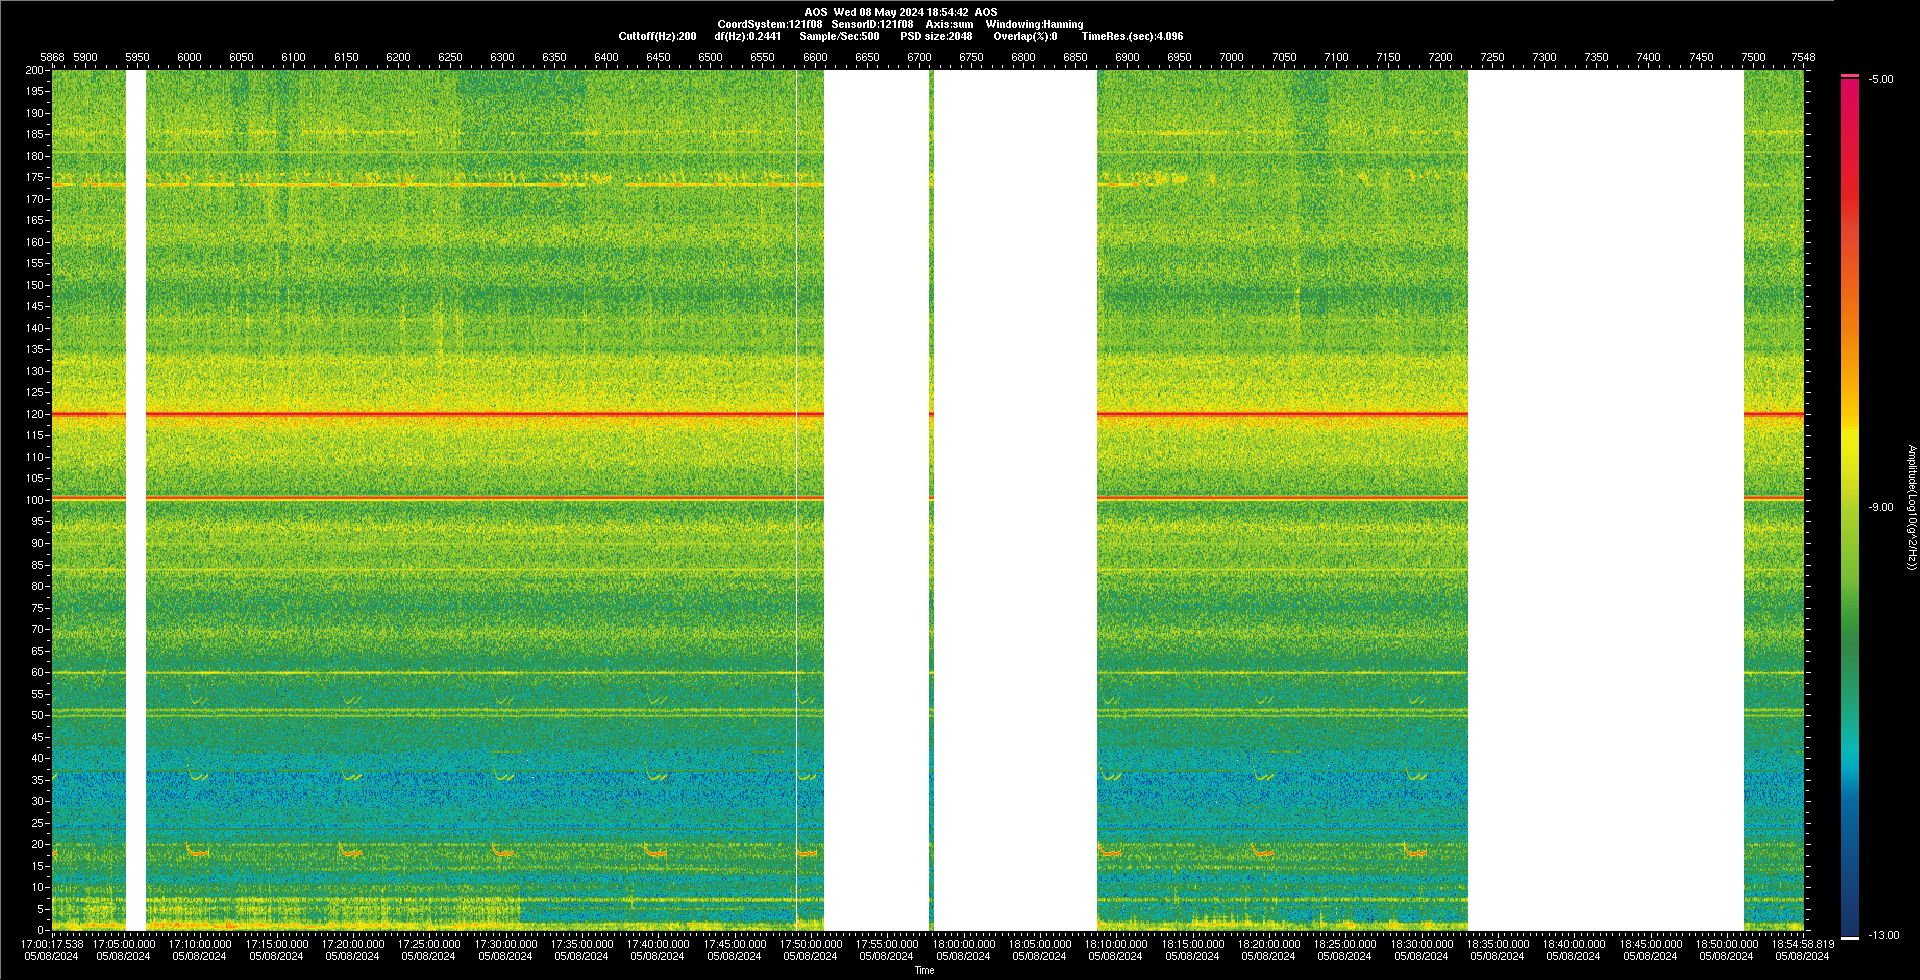
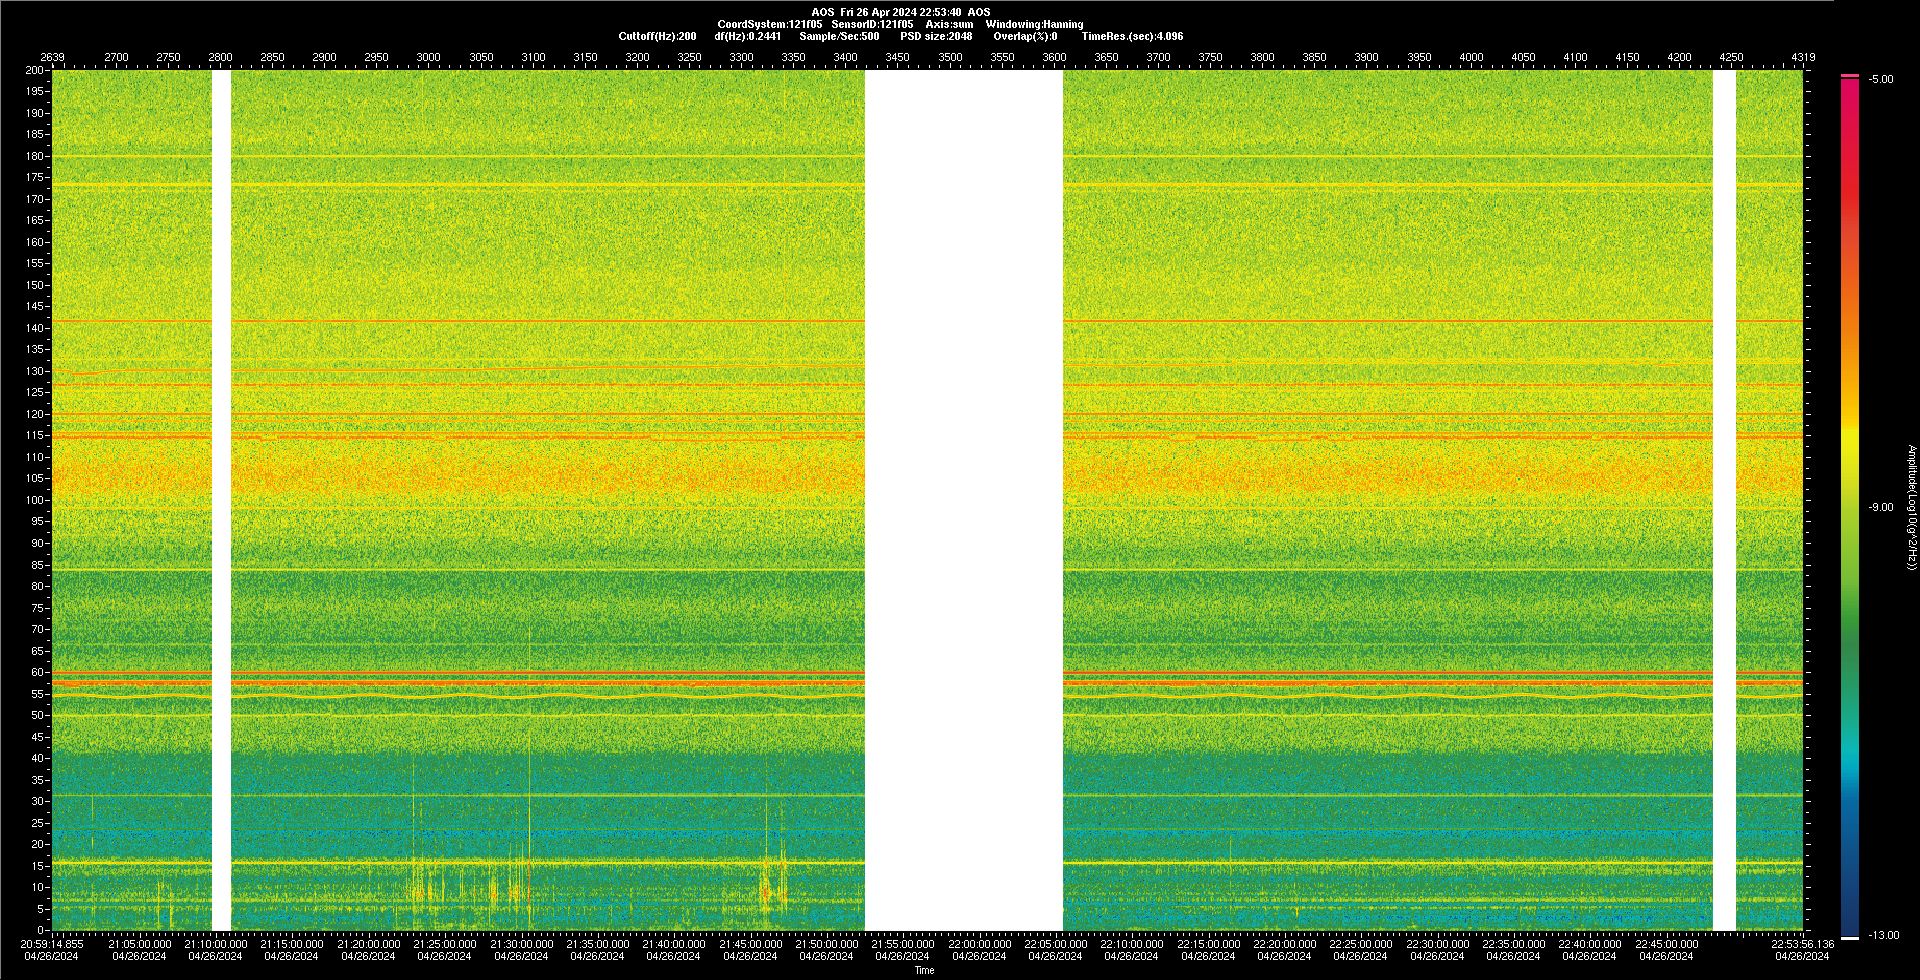
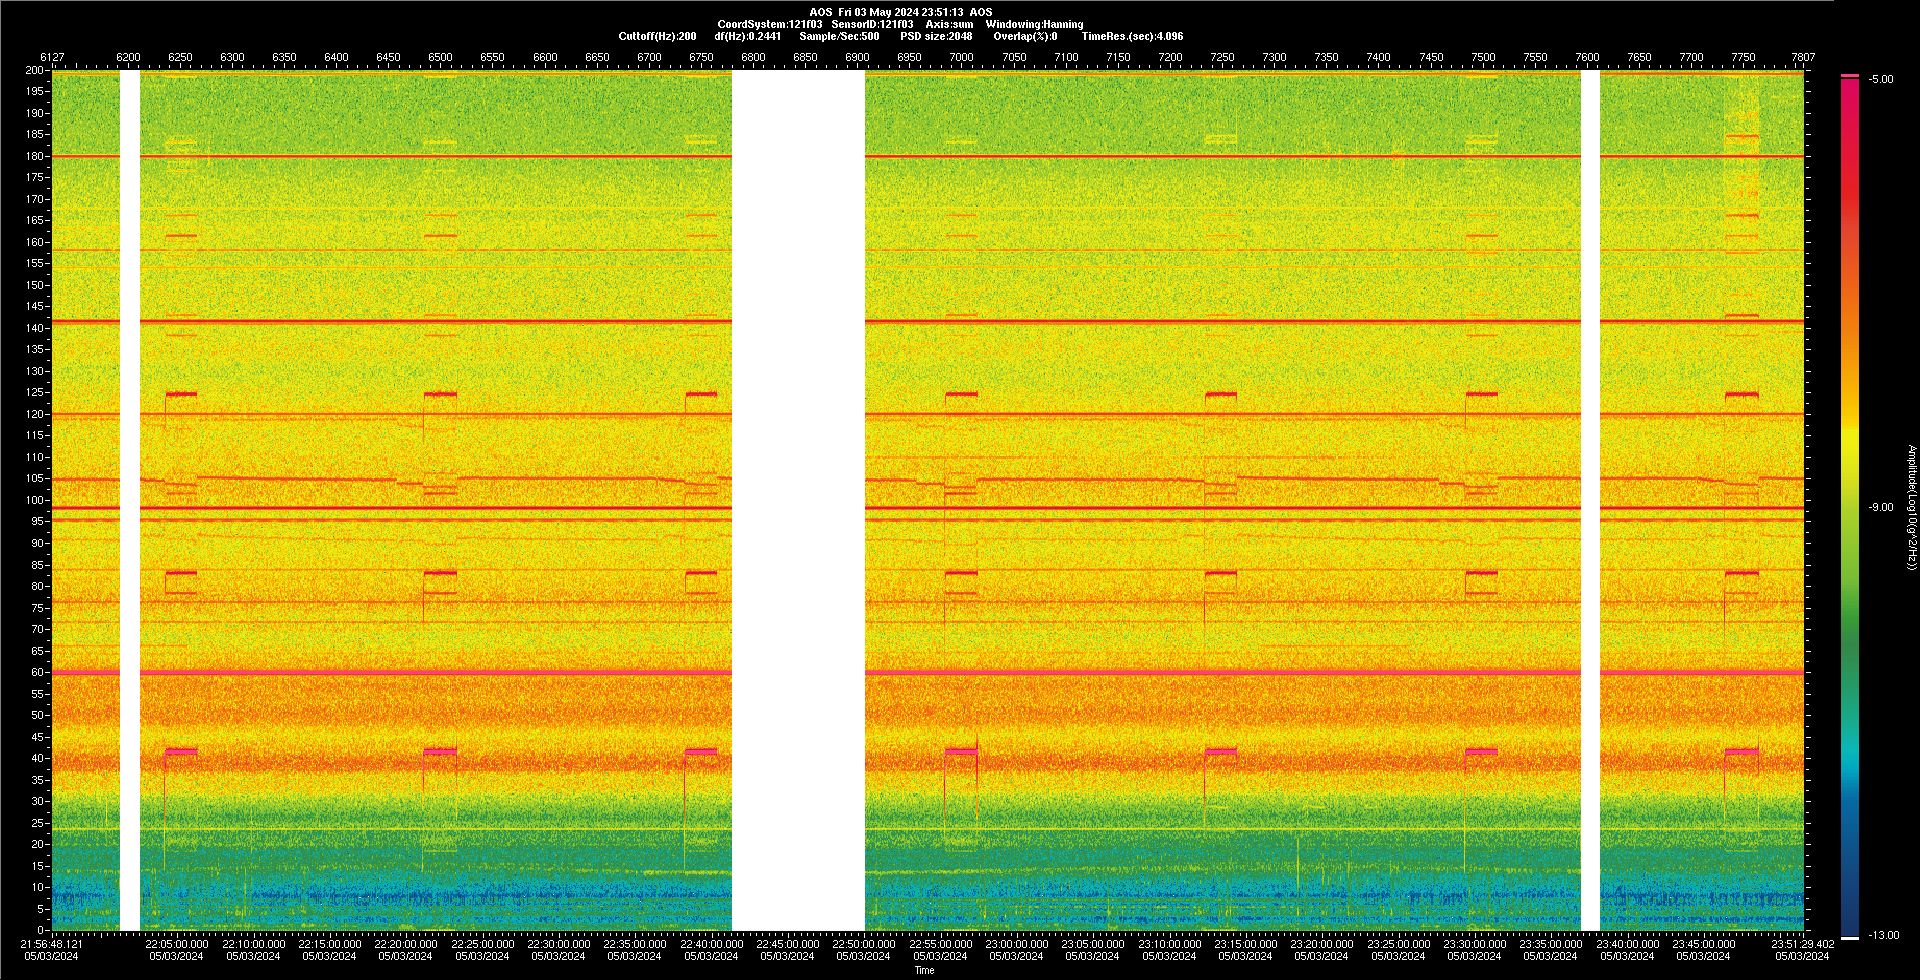
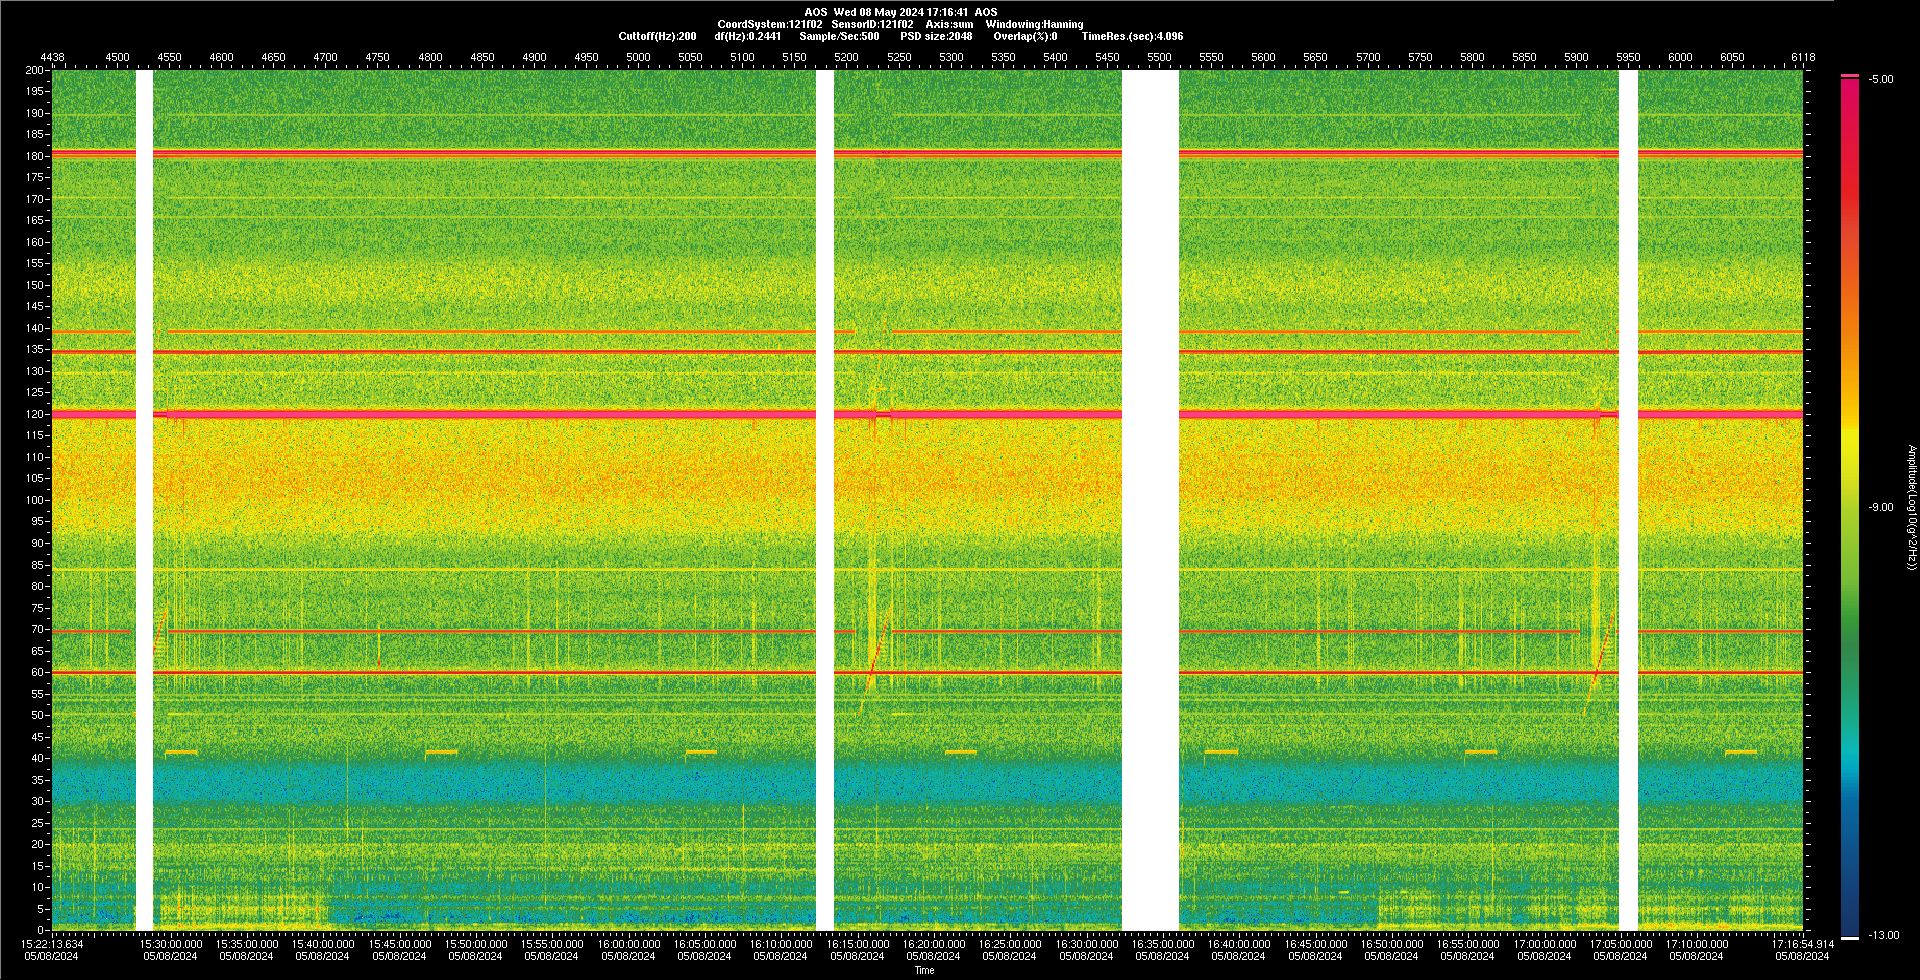
The plots here show the most recent 2 hours (or more) of acceleration measurements from the ISS. These color spectrogram plots serve to qualify and crudely quantify a relatively long...
Show Morespan of high-rate data that has been streamed from the space station. A spectrogram is a good first look at vibratory data, often showing patterns, structures and boundaries in both time and frequency. -
Acceleration Archives
The acceleration archives housed at the NASA Glenn Research Center in Cleveland, Ohio provide a rich set of measurements collected from the International Space Station since its...
Show Morevery earliest days of operations to present day. These data are available for public download and offer the ability to use these measurement data with computer models or to correlate with other scientific measurements. -
Handbook
A catalog of sorts, this series of pages makes available to the public a microgravity environment handbook
Show MoreThis is a compilation of information aimed at characterizing specific aspects or features of disturbance sources measured on the ISS. The main categories in this handbook are the acceleration regime for the given entry: quasi-steady, vibratory, or transient. These are further sub-categorized with respect to the disturbance source: crew-, vehicle- or equipment-related. Most handbook entries characterize the disturbance source of interest in two primary ways: qualify and quantify. First for a handbook entry, there is typically one page dedicated to qualifying the effects of the disturbance source being presented. For the vibratory regime, this is usually a color spectrogram that shows boundaries and structure in both time and frequency. The third dimension on these spectrogram plots is represented by color, which gives a crude indication of magnitude. For the quasi-steady and transient regimes, this qualification is usually in the form of a three-panel, per-axis plot of acceleration versus time. Secondly, for an entry, there is usually a page dedicated to quantifying the effects of the disturbance source. This is intended to address questions like how much or which direction. For the vibratory regime, this quantification is usually some form of RMS plot versus time for a given frequency band. For the quasi-steady and transient regimes, some form of table or plot that depicts average or peak acceleration during the event of interest is the means of quantifying. Finally, most handbook entries include unique details gleaned from analysis of the acceleration measurements and some handbook entries include interesting or ancillary information that are pertinent or related to the topic at hand. -
PIMS Documents
PIMS documents are old increment reports and educational information.
-
Locations
The information here is a tabular breakdown of SAMS on-orbit resources (sensor heads, electronics enclosures, seat track devices, cables) giving current configuration and other details pertinent to tracking these resources.
-
Struc & Mech
This is the PIMS Vibratory Roadmap Browser which allows the user to choose archived vibratory plots from within a calendar.
The Principal Investigator Microgravity Services project at the NASA Glenn Research Center supports NASA’s Microgravity Research Program Principal Investigators by providing acceleration data processing, analysis, archiving and interpretation for a variety of microgravity carriers including the International Space Station, the Space Shuttle, the Russian Mir Space Station, parabolic aircraft, sounding rockets, and drop towers. The PIMS project is funded by the JSC OB8 – Payload Facility & Commercial Element Office and is part of the NASA Glenn Research Center’s Microgravity Measurement and Analysis Project which integrates the analysis and interpretation component of PIMS with the various NASA sponsored acceleration measurement systems.